Digital forensic analysis is complex. There is rarely a straight A-to-B-to-C review with complete timestamps.
Imagine an attacker breaches a host on a business’s domain and kicks off processes that establish connections to four different public internet protocols (IPs) simultaneously. Two of these connections are downloading files, one is sending newly created files, and the fourth is simply listening.
It can be difficult to grasp and understand the intricate actions that the attacker is trying to achieve, or why. As a digital forensic examiner, the act of “visualizing” can help us track investigations in progress, understand and comprehend the important elements of that investigation, and better express the outcomes of those investigations.
Additionally, it can also make you better at your job in future investigations—or improve your skills at the Sunday paper Sudoku puzzle.
Say what, now?
The Visuospatial Sketchpad
Human beings are creatures that primarily learn visually, thanks to what scientists refer to as the “visuospatial sketchpad,” a term used to describe the way our working memory functions.
You can think of our own working memory as random access memory (RAM) if it helps, as it is the place where things we’re actively contemplating reside.
If I were to ask you to imagine an eight ball from a billiards table and rotate it around with your mind’s eye, you would do so by actively using your “visuospatial sketchpad.” The eight ball is now in your brain’s RAM, having been pulled from the folder on your hard drive labeled “Billiards” or “Things I only know about from ESPN2” or “Activities I’ve Only Performed While Drinking.”
It’s easy to understand visualizing a physical object, but we frequently visualize information without being consciously aware of it.
Unlike the eight ball, if I were to ask you what two plus two is, your processing of the question may not feel anything like how we imagined an eight ball. However, try to slow down and imagine that a physical chalkboard is being pulled from your brain’s hard disk drive (HDD) and placed into RAM, and this chalkboard is being used by you to physically write out “2+2=4,” spraying various amounts of chalk dust residue across your subconscious in the process.
This may be a similar mental image to how you learned addition and subtraction as a child. Your brain has since become too fast to recognize such a process taking place, just like a central processing unit (CPU) pulling files is too fast to witness with the human eye.
The Art of Visualization for Digital Forensic Analysis
Jerry Rice, arguably the greatest professional football player of all time, talked about the mental work that went into his game:
“The first rule is simple: You can’t cheat yourself. I can sit down on a Saturday night and know certain predicaments I’ll face on Sunday. Before it happens, I know how a defender will respond to specific routes and how we’ll be able to take advantage. It’s all in my head before I step on the field. I visualize it. I can’t tell you how many times I’ve caught a pass or scored a touchdown and thought, ‘That’s exactly how I knew it would happen.’”
Jerry Rice, ESPN Magazine Interview
Experts in many different fields rely heavily on visualization to be more successful.
Some people are aware of it and use it daily to grow into experts in multiple fields. Magicians, composers, mathematicians, chess grandmasters, Olympic athletes, artists, inventors, and code breakers have all discussed being able to visualize the game, project, or solution they’re working on and see multiple outcomes.
These visualized outcomes can shorten or eliminate the decision-making times that arise throughout, as well as giving confidence in on-the-fly adjustments.
If we can embrace this type of visualization that we are all already doing subconsciously, it will become another tool in our digital forensic analysis, like Plaso or Autopsy, to learn and get better at.
The more proficient you grow with this forensic tool, the more meta-cognitively aware you will be, which essentially means you become better at thinking about thinking.
Those Sudoku puzzles don’t stand a chance.
More than Sudoko puzzles, though, a digital forensic investigator can be better served by visualizing elements of the investigation through a process called timelining. Visualization of multiple timelines in an incident response case is not just helpful in providing an executive summary to the customer—it’s also helpful for us to be better and quicker at our jobs.
Timelining
Have you ever watched a crime show where the detective asks a suspect, “Where were you at the time of the incident?” Of course, we all have. Maybe the answer given by the suspect is directly related to what we already know about the crime, maybe not. We’ll have to put a pin in it and wait 10-15 minutes while the TV investigator gathers more evidence for us to contemplate as viewers.
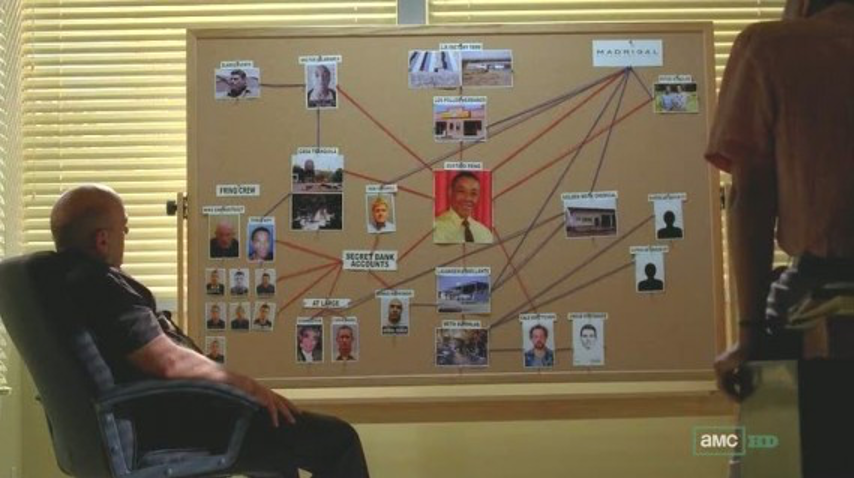
“Put a pin in it” is a popular expression for retaining a thought or piece of information until it can be returned to, with proper full attention, at a later time. While this saying originates from a German expression for putting a pin in a live grenade in order to save the ordnance for later, when many people hear the words “put a pin in it,” they visualize a detective or investigator (not dissimilar from our own TV investigator) pinning a photograph or piece of information to an evidence board.
Evidence boards are a good visualization tool to keep relationships between different objects, people, and physical or digital data in plain view for us—as human beings with a visuospatial sketchpad correlation.
As an investigation moves forward, the amount of evidence needing to be correlated will grow. A seemingly monotonous event or bit of data (like a man recorded by a security camera jogging on Plum Street) could turn out to be a massive piece of evidence when placed in conjunction with others. This is particularly true when their location and timestamps are similar. For example, if a man was recorded jogging on Plum Street two minutes after a 911 call was placed to report a murder at 4232 Plum Street, it may turn out to be a key piece of evidence.
The processes of reconnaissance, consideration, and elimination being performed by our detectives on television is being done in the same order and for the same reasons as a digital forensics investigator working a case.
The beautiful thing about this, if you’re new to timelining, is that it doesn’t require a fancy piece of forensic software, artistic skill, or physical exertion in order to get started. It seriously can be done on a piece of paper with a crayon, or in an Excel spreadsheet.
Getting Started
Start with one event, typically the point of known compromise, and then fill in data before or after that event. Outline anything which may be relevant.
“Which” is important here because when compiling data, we won’t always know which files, processes, or connections may be related to an attack. Putting the events we find on a timeline with multiple threads instead of a raw dump of notes will make correlating them much easier.
An Example
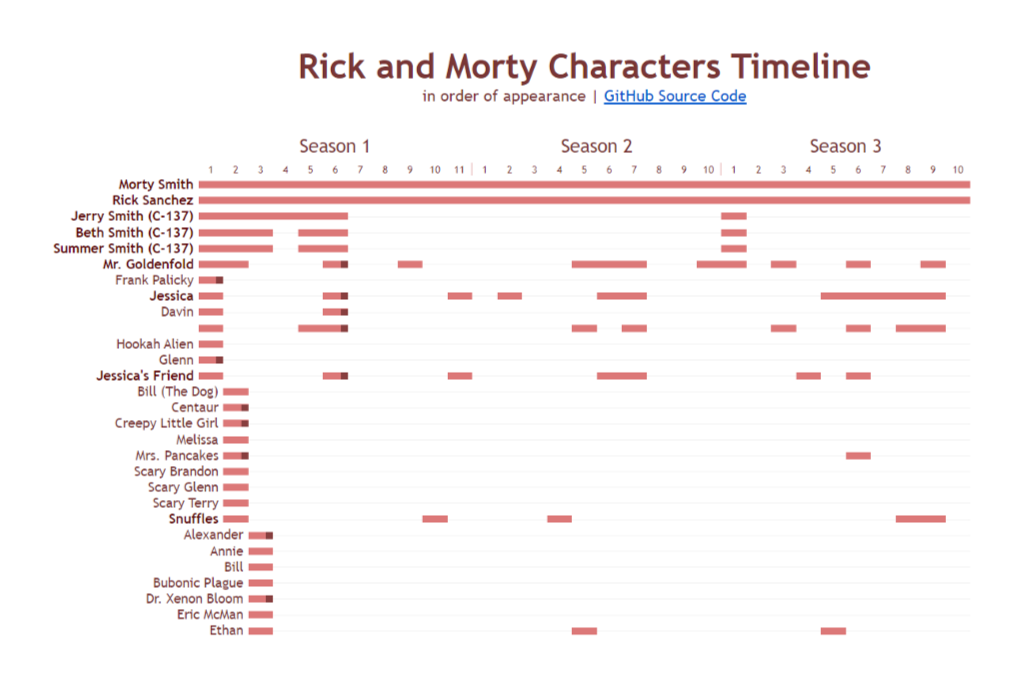
Let’s look at an example of multiple timelines being displayed at once, in an image not related to a security incident.
This is a partial grab of a timeline of all the characters that appear in the cartoon Rick and Morty, according to their season and episode number. If we were trying to find evidence of an event that took place involving Jessica and Jessica’s Friend, we’d have a much easier time determining which episodes we should be interested in, rather than combing the entire series for evidence.
For a digital forensic analysis or investigation, a timeline of our building could take place over a day, a week, or months.
Instead of the appearance of characters, the horizontal fields could represent the activities of files, users, connections, or servers/workstations.
In the scenario we imagined in the opening paragraph, the timeline could start with our solo host known to have been breached. We could start with a separate timeline for each of the four external connections, color-code them, and place the actions and associated files from each of them according to their timestamps (don’t forget to consider time zone, and skew when making these placements).
At some point in the past or future, we will find correlations between them that will help direct our investigation and assist us in understanding and conveying the full story of the attack—as well as the attacker’s intent.
Conclusion
Visualization and timelining are skills that can drastically improve our ability to respond to and investigate security incidents. By placing potentially correlated events on a timeline, we can more easily visualize cause and effect.
Ultimately, these exercises can help us pinpoint the potential causes and motivations of an incident—and help us come to conclusions more quickly within our digital forensic analysis. Practicing and getting good at timelining is a skill that can help you both determine the root cause of an incident, but also help you quickly curb any future incidents that may occur.
To learn more about incident response, or for assistance with preparing for and handling incidents, visit frsecure.com.


